Sydney NS Radar Map: Practical Guide for Weather Tracking and Travel Planning
When navigating Sydney, Nova Scotia’s coastal weather patterns, a reliable Sydney NS radar map becomes an essential tool for residents, travelers, and outdoor enthusiasts. Unlike static weather forecasts, a live radar map provides real-time updates on precipitation, storm intensity, and movement—critical for avoiding delays or hazards. Whether you're planning a fishing trip, a drive along the Cabot Trail, or simply deciding whether to carry an umbrella, understanding how to interpret and use this radar can save time and reduce risks.
Why a Sydney NS Radar Map Outperforms Basic Forecasts
A radar map doesn’t just tell you it will rain; it shows where and how hard it’s falling right now. For Sydney, located on Cape Breton Island’s eastern shore, this is particularly valuable due to the region’s rapid weather shifts. A slow-moving system over the Atlantic can intensify unexpectedly, while localized fog banks rolling in from the Bras d’Or Lake can reduce visibility in minutes. A radar map captures these nuances, allowing you to track storms as they develop offshore and move inland—something a 3-hour forecast bulletin can’t do.
For example, if a low-pressure system approaches from the south, the radar will reveal whether the heaviest rain bands will hit the Sydney airport area first or if they’ll veer east toward the Mira River valley. This level of detail is crucial for pilots, mariners, and even commuters choosing between Route 125 and the Trans-Canada Highway.
Key Features to Look for in a Sydney Radar Map
Not all radar maps are created equal. When selecting a tool for Sydney NS, prioritize these features:
- Real-time updates: Look for a map with refresh rates of 5–10 minutes. Older systems may lag by 15–30 minutes, missing fast-moving cells.
- Dual-polarization data: This advanced radar technology distinguishes between rain, hail, and snow, reducing false alarms during winter storms.
- Storm tracking overlays: Some maps allow you to draw a line along a storm’s path, estimating arrival times for specific neighborhoods like Whitney Pier or North Sydney.
- Historical playback: Useful for post-storm analysis, such as verifying if a sudden downpour caused localized flooding near the Sydney Tar Ponds.
For mobile users, apps like WeatherCAN or RadarScope offer these capabilities, while Environment Canada’s official radar page provides the most trusted source for raw data.
Practical Applications for Locals and Visitors
Sydney’s tourism industry relies heavily on accurate weather insights. A delayed whale-watching tour or a canceled golf outing due to sudden rain can disrupt itineraries. By checking the radar map the night before or morning of an excursion, operators can make informed calls. For instance, if a band of showers is tracking north of the city, the Louisbourg Lighthouse might still offer clear views of the ocean.
Residents planning outdoor events—from the Cape Breton Highland Games to a backyard barbecue—can use the radar to time activities around weather windows. A 30-minute break in precipitation might be enough to move chairs outside or cover a patio set.
For those unfamiliar with Sydney’s microclimates, the radar helps identify which areas are most vulnerable. The low-lying parts of the city near the harbor often see heavier rain due to orographic lift, while higher elevations like the Coxheath hills may stay drier. This knowledge is invaluable for contractors scheduling deliveries or photographers chasing dramatic coastal skies.
Common Pitfalls and How to Avoid Them
Even the best radar map has limitations. One frequent mistake is misinterpreting “virga”—precipitation that evaporates before hitting the ground. On a radar, this appears as green or yellow echoes, but if you step outside expecting rain, you might be caught off guard. Another issue is ground clutter, where buildings or terrain near the radar site (like the highlands west of Sydney) create false echoes. Cross-referencing with satellite imagery or surface observations can clarify these situations.
Users should also be cautious with “radar gaps.” The Sydney radar station (located near Marion Bridge) has a blind spot to the southwest due to terrain blockage. Storms forming in that direction may not appear until they’re already close to the city. For this reason, supplementing radar with observations from nearby stations in New Brunswick or Prince Edward Island can provide a more complete picture.
Beyond the Map: Integrating Radar with Other Tools
A radar map is most effective when paired with other weather resources. For instance, combining radar data with wind forecasts from the Sydney Marine Weather Portal helps mariners anticipate rough seas near the entrance to Sydney Harbour. Similarly, pairing the radar with lightning detection networks (like Blitzortung) can warn of impending thunderstorms before they show up on the map.
For winter travelers, overlaying radar with Environment Canada’s winter storm warnings can highlight areas at risk for freezing rain or heavy snow. A map showing both precipitation type and intensity is far more actionable than a text alert alone.
Ultimately, a Sydney NS radar map is more than a digital tool—it’s a decision-making aid that bridges the gap between forecast predictions and real-world conditions. Whether you’re a local avoiding a flooded road or a visitor timing a scenic drive, using the radar strategically can turn unpredictable weather into a manageable part of your day.
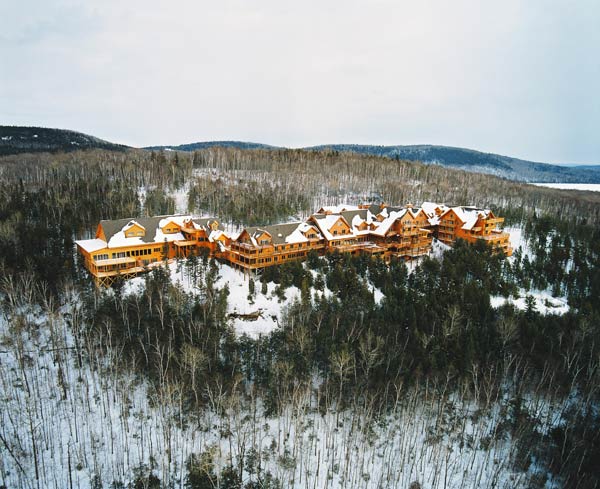
Hôtel Sacacomie -ForfaitsVacancesQuebec.com

Hôtel Sacacomie -ForfaitsVacancesQuebec.com
Lac Sacacomie

Lac Sacacomie
Forfait Le Meilleur De La Nature - Hôtel Sacacomie

Forfait Le Meilleur de la Nature - Hôtel Sacacomie ...
Hôtel Sacacomie -ForfaitsVacancesQuebec.com

Hôtel Sacacomie -ForfaitsVacancesQuebec.com