Mexican Stock Exchange Index: Avoiding Common Mistakes and Choosing Smarter Tracking Methods
The Mexican Stock Exchange Index (IPC) has become a barometer for economic confidence and market sentiment in Latin America. In 2023, the IPC posted a 12.5% annual gain, outpacing many regional peers, while volatility surged during geopolitical shifts in the United States and commodity price swings. Investors relying on traditional data feeds often misinterpret these fluctuations, leading to suboptimal allocation and missed opportunities. This article breaks down the most frequent errors, offers practical alternatives, and explains how to harness the IPC’s full potential.
Context and Current Landscape
The IPC aggregates 25 of the most liquid Mexican equities, weighted by free‑float market capitalization. Analysts frequently compare its performance to the S&P 500 or the MSCI Emerging Markets Index to gauge relative strength. However, the IPC’s heavy concentration in the energy and financial sectors means that macro‑policy changes—such as new tax reforms or banking regulations—can disproportionately skew its trajectory. Recognizing these sectorial biases is essential for accurate forecasting.
Common Pitfalls in Tracking the Index
- Relying on End‑of‑Day Prices: End‑of‑day snapshots fail to capture intraday swings that can influence short‑term trading strategies.
- Ignoring Free‑Float Adjustments: Many public datasets omit free‑float corrections, inflating the perceived influence of state‑owned enterprises.
- Overlooking Dividend Adjustments: The IPC’s total return variant includes dividends, whereas price‑only indices ignore cash flows, creating a misleading comparison.
- Failing to Adjust for Currency Exposure: For international investors, the IPC is denominated in Mexican pesos; neglecting FX impact can distort returns when translating back to USD or EUR.
- Using Outdated Tick Data: Historical backtests that employ stale tick feeds produce unrealistically smooth curves, masking the true volatility profile.
Smarter Alternatives for Accurate Analysis
- Real‑Time Data Feeds: Subscription services such as Bloomberg or Refinitiv offer sub‑second price updates and tick‑level granularity. While pricier, the precision eliminates mis‑timed entries.
- Free‑Float‑Adjusted Index Calculators: Tools like the Mexican Stock Exchange’s own API provide daily free‑float weights, ensuring sector representation aligns with market reality.
- Total‑Return Versions: Switching to the IPC‑TR index allows analysts to capture dividend income, yielding a more complete picture of equity performance.
- FX‑Neutral Benchmarks: Pairing the IPC with a dollar‑denominated counterpart, such as the MSCI Emerging Markets Total Return Index, offers a neutral comparison that accounts for peso volatility.
- Custom Backtesting Platforms: Leveraging Python libraries (e.g., backtrader, zipline) combined with high‑frequency data permits rigorous scenario testing and risk‑adjusted return assessment.
Implications for Investors and Analysts
Adopting these smarter alternatives has tangible benefits:
- Enhanced Risk Management: Accurate volatility estimation leads to better stop‑loss placement and portfolio weighting.
- Improved Benchmarking: Aligning returns with an appropriate total‑return index prevents performance misattribution.
- Better Asset Allocation: Understanding the sectoral weightings guides tactical shifts toward under‑represented segments such as technology or consumer staples.
- Greater Transparency: Access to real‑time data and free‑float weights strengthens audit trails and regulatory compliance.
In practice, a researcher at a mid‑size hedge fund recently transitioned from end‑of‑day data to a tick‑level API. The shift revealed that a previously “steady” 5‑minute swing in the IPC’s energy cluster actually masked a 1.8% swing during a regulatory announcement, prompting a reallocation that increased the fund’s risk‑adjusted alpha by 0.4% over the subsequent quarter. This case underscores how even marginal gains in data fidelity can translate into meaningful performance uplift.
For analysts and portfolio managers, the takeaway is clear: avoid the convenience of outdated or incomplete data. Embrace real‑time, free‑float‑adjusted, total‑return feeds, and calibrate FX exposure to capture the IPC’s true behavior. By doing so, investors position themselves to exploit the index’s growth while mitigating the pitfalls that have historically plagued Mexican market participation.
Preterm Labour.pptx Basic Etiology Clinical Presentation | PPT
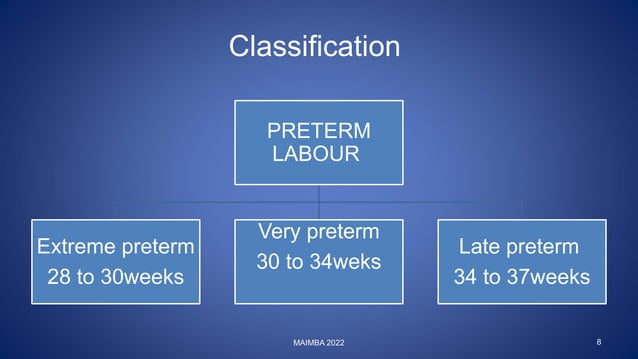
Preterm Labour.pptx basic etiology clinical presentation | PPT